freight pricing AI automation
Freight Pricing AI That Wins More Deals at Better Margins
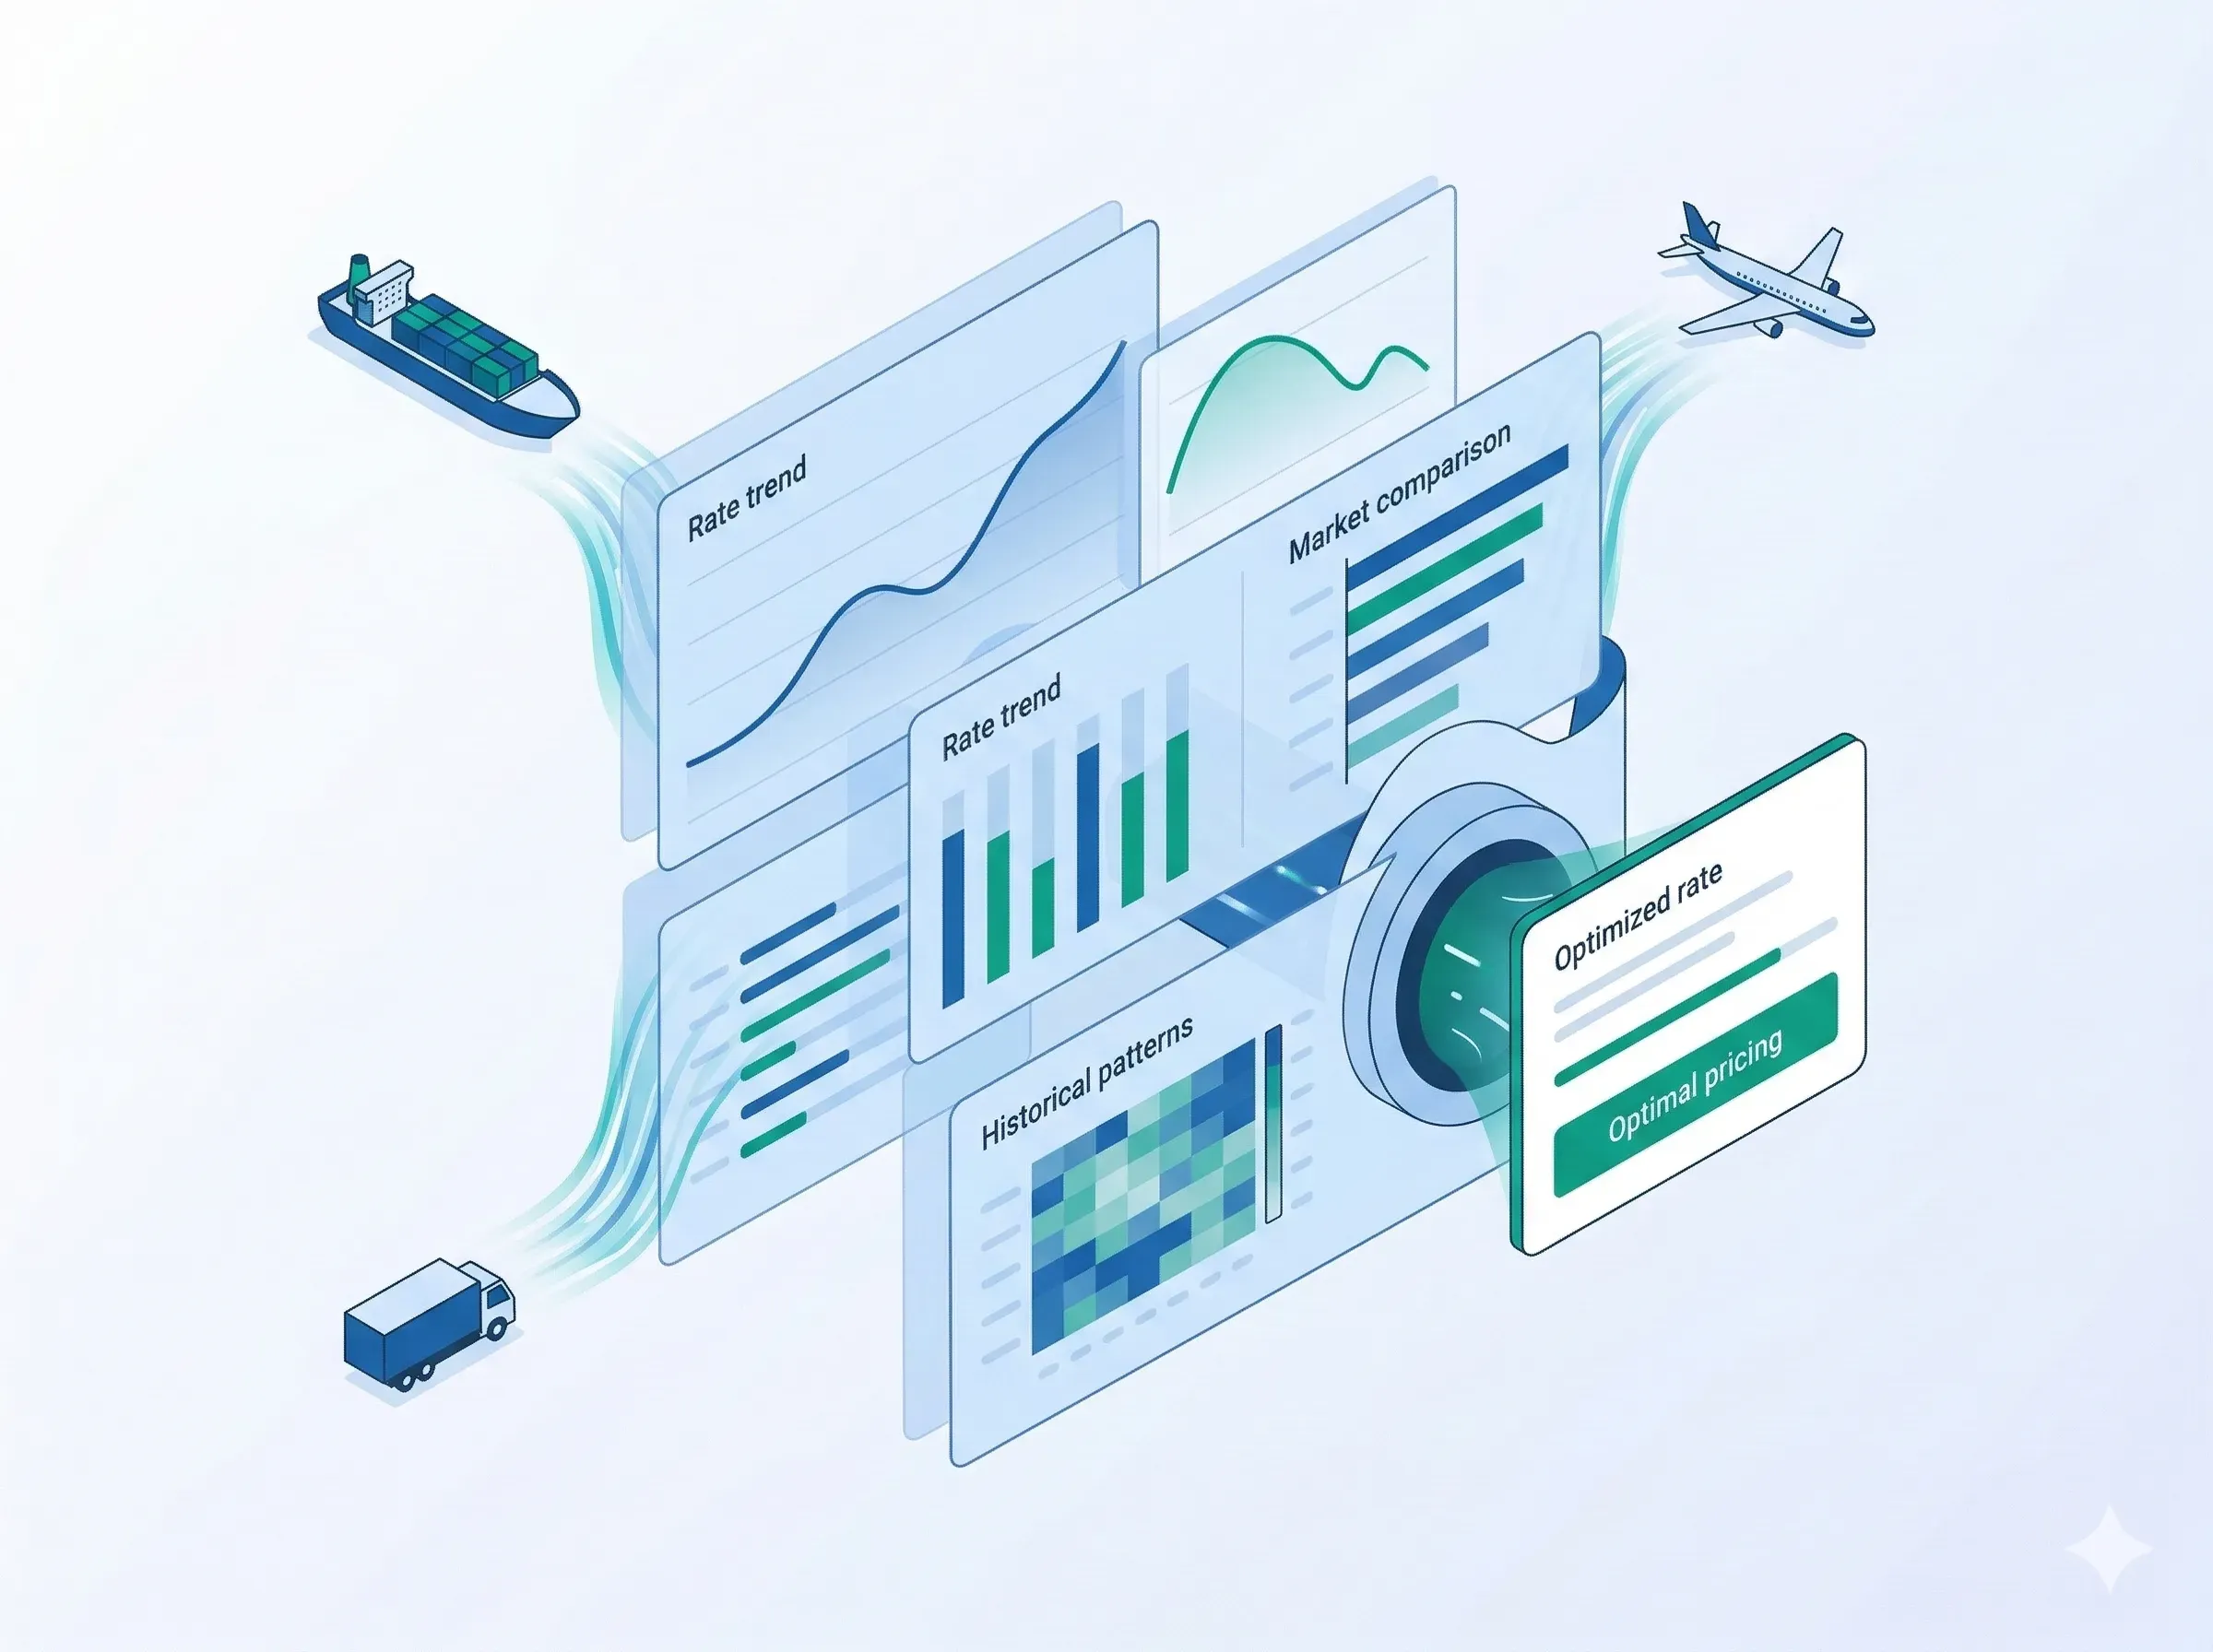
AI-powered freight pricing intelligence — dynamic rate optimization, market benchmarking, and margin protection for sea and air freight forwarders.
Freight pricing software powered by AI that analyzes market rates, optimizes your pricing, and gives your sales team real-time intelligence — so you win more deals at better margins through dynamic freight pricing.
Built For
Who Needs Pricing AI Automation
- Freight forwarders whose pricing decisions are based on gut feel, outdated spreadsheets, or "what we charged last time"
- Pricing teams managing 500+ active rate cards across multiple trade lanes
- Companies losing margin because sales reps under-price to win deals or over-price and lose them
- Forwarders on volatile trade lanes (Asia-Europe, Trans-Pacific) who need real-time market awareness
Before FreightMynd
Your freight rates are either leaving margin on the table or losing deals you should have won
Freight pricing is one of the most impactful decisions in forwarding, yet most companies treat it as an afterthought. Rate data lives in disconnected spreadsheets, carrier portals, and individual reps' heads. Pricing decisions are made based on "what we charged this customer last time" or "what feels competitive" rather than real-time market intelligence. The result: you over-price stable lanes and lose volume to hungrier competitors, or you under-price volatile lanes and give away margin during surges. Neither outcome is visible until the P&L lands — by then, the damage is done. Meanwhile, your pricing team spends most of their time on data gathering and rate maintenance rather than strategic analysis.
Rate data scattered across 5–15 carrier portals, internal spreadsheets, rate management systems, and email confirmations — no single source of truth
Pricing decisions lag market movements by days or weeks because manual rate analysis cannot keep pace with volatile markets
No visibility into whether you are pricing competitively on specific lanes until you see win/loss patterns months later
Sales reps negotiate ad-hoc discounts without understanding the margin impact or how the lane is performing overall
Contract rate reviews happen annually or semi-annually, leaving 6–12 months of market shifts unaddressed
Cannot answer basic questions like "what is our margin on Asia-Europe FCL this month?" without a manual data pull that takes days
What We Build
Pricing AI AI Capabilities
Real-time market rate benchmarking
Integrates with Xeneta, Freightos Baltic Index, carrier spot rate APIs, and your own historical data to provide real-time visibility into where the market is on any lane. Benchmarks your current pricing against market rates, contracted rates, and competitor positioning (inferred from win/loss patterns) — showing you exactly where you are over- or under-priced.
Dynamic freight pricing optimization by lane, customer, and volume
Replaces flat markups with intelligent dynamic freight pricing that considers lane competitiveness, customer lifetime value, volume commitments, market direction (pricing trending up or down), and your capacity position. The system recommends optimal pricing for each quote that balances win probability against margin targets — not just the lowest price that wins, but the highest price that still wins.
Margin analysis and pricing protection alerts
Real-time margin visibility across your book of business — by lane, customer, mode, and time period. Automated alerts when margins drop below thresholds (globally or per lane), when carrier pricing changes make your quotes uncompetitive or under-priced, or when a customer's volume-to-margin ratio deteriorates. This freight pricing software replaces the "surprise" in your monthly P&L with proactive intervention.
Carrier pricing comparison and normalization
Automatically aggregates pricing from all your carrier sources, normalizes them to a comparable format (handling different surcharge structures, currency, and validity periods), and presents apples-to-apples comparisons. Includes total cost analysis that factors in carrier reliability, transit time, and your historical claims rate — because the cheapest rate isn't always the cheapest shipment.
Historical trend analysis and rate forecasting
Analyzes 12–36 months of your historical rate data alongside market indices to identify seasonal patterns, lane-specific trends, and carrier pricing behavior. The forecasting model provides 30/60/90-day rate direction estimates with confidence intervals — helping your pricing team make proactive decisions rather than reactive adjustments.
Rate management system integration
Connects to your existing rate management systems (CargoWise rate module, Cargobase, Freightos, custom databases) to both consume rate data and push optimized pricing back. This means pricing recommendations aren't just reports — they can directly update your quoting systems so sales reps always work from current, optimized rates.
In Practice
Pricing AI Use Cases in Production
Proactive repricing during a rate surge
Spot rates on Asia-North Europe jump 35% over two weeks due to capacity constraints. The system detects the shift in real-time via carrier API feeds and market indices, identifies all your pending quotes and active contracts on affected lanes, and alerts the pricing team with specific repricing recommendations. Instead of discovering the margin erosion in next month's P&L, you adjust within 24 hours.
Customer-specific pricing strategy
A key account is up for contract renewal. The system provides a complete analysis: historical volume and margin by lane, competitive positioning based on market rates, the customer's price sensitivity inferred from win/loss patterns on past quotes, and recommended rate cards that protect margin while maintaining competitiveness. Your pricing team walks into the negotiation with data, not guesswork.
Lane profitability analysis for strategic decisions
Management wants to know which trade lanes are most profitable and which are margin-negative. The system produces an analysis within minutes — total margin by lane, margin trend direction, volume stability, competitive intensity, and recommendations for where to invest sales effort versus where to raise prices or deprioritize.
Implementation
How We Deploy Pricing AI AI
Timeline: 8–12 weeks from kickoff to production
Weeks 1–2: Data audit — catalog rate sources, historical data availability, current pricing logic, and margin reporting
Weeks 3–5: Rate aggregation pipeline, market data integration, historical analysis model training
Weeks 6–9: Dynamic pricing engine, margin monitoring dashboards, alert configuration, rate management system integration
Weeks 10–12: UAT with pricing team, backtesting pricing recommendations against historical outcomes, production deploy
Results
Measurable Impact
12%
Average margin improvement
25%
Better win rates on target lanes
60%
Faster rate analysis
0
Below-cost quotes sent
| Metric | Result | Context | Business Outcome |
|---|---|---|---|
| Average margin improvement | 12% | Achieved by replacing flat markups with dynamic pricing that optimizes for each lane-customer combination | — |
| Better win rates on target lanes | 25% | Competitive pricing intelligence ensures quotes are priced to win where you want to grow volume | — |
| Faster rate analysis | 60% | Pricing team spends 60% less time on data gathering and manual comparison, focusing on strategic analysis | — |
| Below-cost quotes sent | 0 | Floor pricing rules and real-time margin checks prevent any quote from going out below your cost basis | — |
Achieved by replacing flat markups with dynamic pricing that optimizes for each lane-customer combination
Competitive pricing intelligence ensures quotes are priced to win where you want to grow volume
Pricing team spends 60% less time on data gathering and manual comparison, focusing on strategic analysis
Floor pricing rules and real-time margin checks prevent any quote from going out below your cost basis
Proof in Production
AI-Powered RFQ Email Intelligence & Completion System
Enterprise-grade RFQ email intelligence system that monitors incoming RFQ emails, classifies them, detects missing info, auto-sends clarification emails, and delivers structured ready-to-price RFQs — achieving 85% faster quote turnaround.
AI-Powered RFQ & Email Automation System
End-to-end procurement-side RFQ lifecycle automation — from incoming RFQ intake through vendor selection, distribution, quotation capture, and HITL negotiation. Unlike sell-side RFQ intelligence (customer-facing quote completion), this system automates the buy-side vendor management workflow.
Works with your existing TMS
Direct integration with CargoWise, SAP TM, Oracle TMS, Microsoft Dynamics, and Descartes.
Pricing AI — Frequently Asked Questions
How does freight pricing AI work?
Can it predict rate changes?
Does it work for both sea and air freight?
How does it handle contract vs spot rates?
What data does it need to get started?
How is this different from a rate management system?
Related Freight AI Solutions
Quote Management
AI-powered freight quote generation, comparison, and response automation. Automate every freight quote from spot quotes to contract rates — reduce turnaround from hours to minutes.
Rate Intelligence
AI that ingests carrier rate sheets in any format (PDF, Excel, email), normalises them into a structured database, compares rates across carriers by lane, and powers your quoting engine with always-current pricing.
Spend Analytics
AI-powered freight spend analytics — real-time visibility into transportation costs by carrier, lane, mode, and service level. Built from your actual invoice and shipment data, not estimates.
Carrier Analytics
AI-powered carrier scorecards — on-time performance, transit time accuracy, damage rates, cost benchmarking, and exception frequency — built from your own shipment data, not industry averages.
Ready to Automate Your Pricing AI?
Book a free audit. We'll show you exactly what we'd build for your operations.